When your laptop suddenly shuts down in the middle of work or your gaming PC starts sounding like a jet engine, it’s usually not random bad luck. It’s heat. And that’s where openhardwaremonitor quietly becomes one of the most powerful free tools you can install.
Most people don’t realize how important it is to track CPU temperature and hardware health until something goes wrong. In reality, monitoring your system proactively can extend its lifespan, prevent costly repairs, and even boost performance. Whether you’re a casual user, a gamer, or someone experimenting with overclocking, understanding what’s happening inside your PC gives you control—and peace of mind.
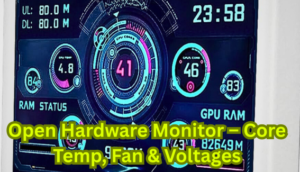
Right after installation, openhardwaremonitor reveals real-time sensor data that most operating systems hide. Temperatures, voltages, fan speeds, and clock speeds suddenly become visible. It feels like turning on the lights in a dark room.
What Is OpenHardwareMonitor?
At its core, openhardwaremonitor is a free, open-source hardware monitoring software designed for Windows systems. It reads sensor data from your motherboard, CPU, GPU, and hard drives to display critical metrics like:
- CPU temperature
- GPU temperature
- Fan speed (RPM)
- Voltage levels
- Clock speeds
- Hard drive SMART data
Unlike many premium system monitoring tools, openhardwaremonitor doesn’t overwhelm users with unnecessary features. Instead, it focuses on clarity and real-time data.
Definition: Hardware Monitoring Software
Hardware monitoring software is a utility that reads sensor data embedded in computer components to track performance and environmental conditions like heat and voltage.
The beauty of openhardwaremonitor lies in its simplicity. It runs as a lightweight executable file—no complex installation process, no hidden background services draining resources.
How OpenHardwareMonitor Works
Your motherboard contains embedded sensors that constantly measure thermal and electrical conditions. CPUs and GPUs also include integrated thermal diodes. openhardwaremonitor communicates directly with these sensors through low-level hardware interfaces.
Here’s what happens behind the scenes:
- The software queries sensor chips via the SMBus.
- It retrieves temperature, voltage, and clock data.
- It converts raw values into readable metrics.
- It displays them in a structured tree format.
In other words, it translates machine-level readings into human-friendly data.
However, compatibility depends on your hardware. Some newer chipsets may require updated forks or community builds for full sensor access.
Key Features of OpenHardwareMonitor
Real-Time CPU Temperature Tracking
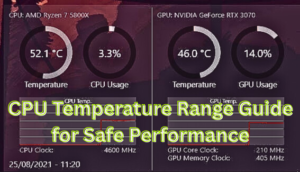
This is the primary reason most users download openhardwaremonitor. It displays per-core CPU temperatures, which is especially helpful for diagnosing uneven thermal distribution.
For example:
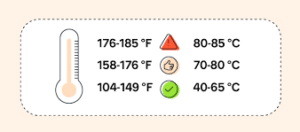
- Idle temperature: 30°C–45°C (normal)
- Moderate load: 50°C–70°C
- Heavy load: 70°C–85°C
- Above 90°C: Potential risk zone
GPU Monitoring
Gamers love this feature. GPU temperatures often spike during high-resolution gaming sessions. Monitoring prevents thermal throttling.
Voltage Monitoring
Voltage irregularities can cause instability or crashes. openhardwaremonitor tracks:
- CPU core voltage (Vcore)
- +12V rail
- +5V rail
- +3.3V rail
Fan Speed Tracking
If your fans are failing or underperforming, RPM readings help diagnose airflow issues.
Portable Application
No installation required. Simply download and run.
How to Download and Install OpenHardwareMonitor
Setting up openhardwaremonitor is refreshingly simple:
- Visit the official open-source repository.
- Download the latest stable version.
- Extract the ZIP file.
- Run the executable as Administrator.
That’s it.
However, if you want auto-start with Windows:
- Place a shortcut in the Startup folder.
- Enable “Run on Windows Startup” if available.
No intrusive pop-ups. No forced updates. Just a clean interface.
Monitoring CPU Temperature with OpenHardwareMonitor
Why CPU Temperature Matters
Modern CPUs can throttle performance automatically when temperatures exceed safe limits. Thermal throttling reduces clock speeds to prevent damage.
Over time, excessive heat can:
- Shorten processor lifespan
- Degrade thermal paste
- Warp motherboard traces
- Cause unexpected shutdowns
Using <strong>openhardwaremonitor</strong> regularly helps you detect overheating early.
Interpreting Temperature Readings
Not all spikes are dangerous. For instance:
- A short spike to 85°C during gaming is normal.
- Sustained temperatures above 95°C are concerning.
Environmental factors matter too:
- Room temperature
- Case airflow
- Dust accumulation
- CPU cooler quality
Real-Life Example
A content creator noticed rendering times increasing. Using openhardwaremonitor, he discovered CPU temps were hitting 98°C due to dried thermal paste. After reapplying paste, temperatures dropped to 72°C—and performance improved instantly.
GPU, Fan Speed, and Voltage Tracking
GPU Temperature Monitoring
Graphics cards can safely run hotter than CPUs, often up to 85°C under load. However, sustained temperatures above 90°C may indicate airflow issues.
Fan Speed Analysis
If CPU temperature rises but fan RPM remains low, you may have:
- Incorrect BIOS fan curve settings
- Faulty fan headers
- Dust blockage
Voltage Stability
Voltage fluctuation can signal:
- Power supply instability
- Motherboard VRM stress
- Overclocking errors
Using <strong>openhardwaremonitor</strong> to watch voltage rails during stress tests is a smart preventive measure.
Using OpenHardwareMonitor for Overclocking
Overclocking pushes hardware beyond factory specifications. While it increases performance, it also increases heat output.
Before overclocking:
- Monitor baseline temperatures.
- Run stress tests (Prime95, AIDA64).
- Ensure adequate cooling.
During overclocking:
- Watch CPU core temperatures.
- Track Vcore voltage changes.
- Monitor clock speed stability.
Overclocking without monitoring is like driving fast without checking your engine temperature gauge.
Common Issues and Troubleshooting
Sensors Not Showing
Some newer CPUs may not be fully supported. Solution:
- Use updated community builds.
- Check motherboard compatibility.
Inaccurate Temperature Readings
Possible causes:
- Outdated BIOS
- Incorrect sensor calibration
- Conflicting monitoring software
High Idle Temperature
Check:
- Background CPU usage
- Cooling system
- Ambient room temperature
If openhardwaremonitor shows consistent overheating, immediate action prevents hardware damage.
Alternatives to OpenHardwareMonitor
While openhardwaremonitor is powerful, alternatives include:
- HWMonitor
- Core Temp
- MSI Afterburner
- HWiNFO
However, many users prefer openhardwaremonitor because:
- It’s open-source.
- No ads or bloatware.
- Lightweight design.
Frequently Asked Questions
Is openhardwaremonitor safe to use?
Yes. It is open-source and does not modify hardware settings. It only reads sensor data.
Does openhardwaremonitor work on Windows 11?
It works on many Windows 11 systems, though compatibility depends on hardware support.
Can openhardwaremonitor control fan speeds?
No. It monitors fan speed but does not directly control it.
Why is my CPU temperature so high?
Common causes include poor airflow, old thermal paste, overclocking, or dust buildup.
Is openhardwaremonitor better than HWMonitor?
It depends. openhardwaremonitor is open-source and lightweight, while HWMonitor offers more frequent updates.
Does it support AMD and Intel CPUs?
Yes, most AMD and Intel processors are supported.
Can I use openhardwaremonitor for gaming?
Absolutely. Monitoring temperatures during gaming prevents thermal throttling.
Does openhardwaremonitor slow down my PC?
No. It uses minimal system resources.
Conclusion
Keeping an eye on CPU temperature isn’t just for tech enthusiasts—it’s basic digital hygiene. Hardware failures often begin with unnoticed heat buildup. By using openhardwaremonitor, you gain visibility into the invisible world inside your PC.
It’s lightweight, free, and surprisingly powerful. Whether you’re troubleshooting crashes, optimizing airflow, or experimenting with overclocking, monitoring system health makes all the difference.
In the end, protecting your computer isn’t complicated. Sometimes, all it takes is the right tool—and the awareness to use it.