There’s nothing quite as unsettling as hearing your laptop fan roar like a jet engine or feeling your desktop case getting unusually warm. In those moments, you start wondering: Is my CPU overheating? Is my power supply stable? That’s where Open Hardware Monitor – Core temp, fan speed and voltages becomes more than just a tool—it becomes your system’s early warning system.
If you’ve ever worried about CPU temperature spikes during gaming, sudden shutdowns while rendering videos, or unexplained system instability, this guide is for you. Open Hardware Monitor – Core temp, fan speed and voltages gives you real-time insight into what’s happening inside your PC—information most users never see, but power users rely on daily.
In this in-depth article, we’ll explore how it works, why it matters, how to use it effectively, and how it compares with other hardware monitoring tools. Whether you’re a gamer, developer, overclocker, or just someone who wants their PC to last longer, understanding your system’s core temperature, fan RPM, and voltage levels can save you time, money, and frustration.
What Is Open Hardware Monitor?
Open Hardware Monitor is a free, open-source software application designed to monitor hardware sensors in computers. It reads data from temperature sensors, voltage rails, fan controllers, and SMART hard drive attributes.
At its core, Open Hardware Monitor – Core temp, fan speed and voltages is designed to answer one simple question: “Is my PC healthy right now?”
Core Components It Monitors
- CPU core temperature (per core)
- GPU temperature
- Motherboard temperature sensors
- Fan speed (RPM)
- CPU and motherboard voltages
- Hard drive temperatures (via SMART)
- Load percentage for CPU and GPU
- Clock speeds
Unlike many commercial alternatives, it doesn’t overwhelm you with flashy graphics. Instead, it provides structured, real-time sensor data—clean, efficient, and transparent.
Why Monitoring Core Temp, Fan Speed and Voltages Matters
You might think, “If my computer turns on, it’s fine.” In reality, thermal and voltage issues often build quietly before they cause visible damage.
1. Prevent Overheating Damage
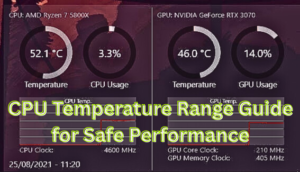
Modern CPUs typically operate safely between:
- 30–50°C at idle
- 60–80°C under load
Sustained temperatures above 90°C can cause:
- Thermal throttling
- Performance drops
- Sudden shutdowns
- Long-term silicon degradation
Using Open Hardware Monitor – Core temp, fan speed and voltages, you can spot rising temperatures before they become dangerous.
2. Ensure Stable Power Delivery
Voltage fluctuations can lead to:
- Random crashes
- Blue screen errors
- Data corruption
Monitoring CPU Vcore, +12V, +5V, and +3.3V rails helps identify power supply issues early.
3. Optimize Fan Curves
When you see fan RPM data in real time, you can:
- Adjust BIOS fan curves
- Improve cooling efficiency
- Reduce unnecessary noise
In reality, many systems run hotter than they need to simply because users never check their thermal performance.
How Open Hardware Monitor – Core temp, fan speed and voltages Works
Open Hardware Monitor reads data from embedded sensors on your motherboard, CPU, and GPU using low-level system access. It supports most Intel and AMD processors and works with common Super I/O chips.
Sensor-Based Monitoring
Each modern motherboard includes:
- Thermal sensors
- Voltage regulators
- Fan tachometers
The software accesses these sensors and displays:
- Real-time values
- Minimum/maximum readings
- Historical trends (if enabled)
It doesn’t guess. It reads actual hardware-level data.
Lightweight Architecture
One of the reasons users prefer Open Hardware Monitor – Core temp, fan speed and voltages is that it consumes minimal system resources. Unlike some tools that run multiple background services, this program can even run as a portable executable.
Key Features and Capabilities
Here’s what makes it stand out:
Real-Time Monitoring Dashboard
You get:
- Per-core temperature readings
- Fan speeds in RPM
- Voltage values with decimal precision
- CPU load percentages
- Clock frequency tracking
System Tray Integration
You can pin:
- Core temperature
- GPU temp
- CPU load
Directly to the system tray for constant visibility.
Remote Monitoring via Web Server
Yes, you can enable a built-in web server to:
- Monitor your PC from another device
- Access sensor data over your local network
Portable Mode
No installation required. You can:
- Run from a USB drive
- Use it for troubleshooting
- Deploy across multiple systems quickly
Installation and Setup Guide
Setting up Open Hardware Monitor – Core temp, fan speed and voltages is straightforward.
Step 1: Download
Download the latest version from the official source.
Step 2: Extract Files
Since it’s portable:
- Extract ZIP file
- Open executable
- Run as administrator (recommended)
Step 3: Configure Settings
Under “Options,” you can:
- Start minimized
- Enable logging
- Enable remote web server
- Minimize to tray
That’s it. No complicated setup process.
Real-World Use Cases
Gaming Sessions
During intense gaming:
- CPU load hits 90–100%
- GPU temperatures spike
- Fans ramp up aggressively
Monitoring Open Hardware Monitor – Core temp, fan speed and voltages ensures your system remains within safe thresholds.
Video Editing & Rendering
Rendering workloads push CPUs to maximum thermal capacity. Watching temperature peaks helps prevent thermal throttling.
Overclocking
If you’re increasing:
- CPU multiplier
- Voltage
- Memory speed
You absolutely need accurate voltage and temperature data. Even a 0.05V increase in Vcore can significantly raise heat output.
Comparison with Other Monitoring Tools
| Feature | Open Hardware Monitor | HWMonitor | Core Temp |
|---|---|---|---|
| Free | Yes | Limited | Yes |
| Open Source | Yes | No | No |
| Voltage Monitoring | Yes | Yes | No |
| Fan Speed Monitoring | Yes | Yes | No |
| Portable | Yes | No | Yes |
| Remote Access | Yes | No | No |
While Core Temp focuses mainly on CPU readings, Open Hardware Monitor – Core temp, fan speed and voltages provides a broader hardware overview.
Understanding CPU Temperature, Fan Speed, and Voltage Readings
CPU Core Temperature
Each CPU core generates heat independently. Modern processors can throttle automatically when reaching thermal limits.
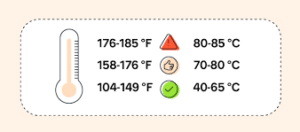
Safe Ranges:
- Idle: 30–50°C
- Load: 60–80°C
- Critical: 90°C+
Fan Speed (RPM)
Measured in revolutions per minute:
- 800–1200 RPM (quiet)
- 1500–2500 RPM (moderate)
- 3000+ RPM (high performance)
Higher RPM means more cooling—but more noise.
Voltage Readings
Stable voltages are critical:
- +12V rail should stay within ±5%
- CPU Vcore should remain stable under load
Fluctuations often signal PSU or motherboard VRM issues.
Common Issues and Troubleshooting
Temperature Not Displayed
- Ensure you run as administrator
- Update motherboard BIOS
Inaccurate Voltage Readings
Sometimes sensors report incorrect data. Cross-check with BIOS.
Fans Not Showing
Not all motherboards expose all fan headers.
Developer Background and Project Insights
Open Hardware Monitor was developed as an open-source initiative aimed at giving users transparent access to their hardware sensor data.
Personal Background
The developers behind the project come from a background in software engineering and hardware systems programming. Their goal was to build a lightweight, accurate, and community-driven monitoring tool without commercial bloat.
Career Journey & Achievements
- Built as an open-source alternative to proprietary tools
- Widely adopted by enthusiasts and IT professionals
- Integrated into troubleshooting workflows globally
Financial Insights
Because the project is open source:
- No subscription fees
- No premium tiers
- Community-supported
Its “net worth” isn’t measured in revenue—but in user trust and adoption.
Frequently Asked Questions
Is Open Hardware Monitor safe to use?
Yes. It’s open source, meaning its code is publicly available for inspection. It does not install background spyware or hidden services.
Can it damage my PC?
No. It only reads sensor data. It does not modify voltages or hardware settings.
Does it work on Windows 11?
Yes, it works on Windows 10 and Windows 11 systems.
How accurate is CPU temperature data?
It reads directly from digital thermal sensors embedded in the CPU, making it highly accurate.
Can I monitor GPU temperatures?
Yes, it supports many AMD and NVIDIA GPUs.
Does it slow down my PC?
No. It’s lightweight and uses minimal CPU and memory.
Can I log temperature data over time?
Yes, logging can be enabled in settings.
Is it better than BIOS monitoring?
Yes, because it provides real-time monitoring while using your PC—not just during boot.
Conclusion
Monitoring your PC isn’t just for overclockers or IT professionals—it’s for anyone who values performance, stability, and longevity. With Open Hardware Monitor – Core temp, fan speed and voltages, you gain visibility into the most critical aspects of your system’s health.
Instead of guessing why your PC feels slow or why it suddenly shuts down, you can see exactly what’s happening in real time. Temperature spikes, unstable voltages, aggressive fan behavior—all become measurable, manageable variables.